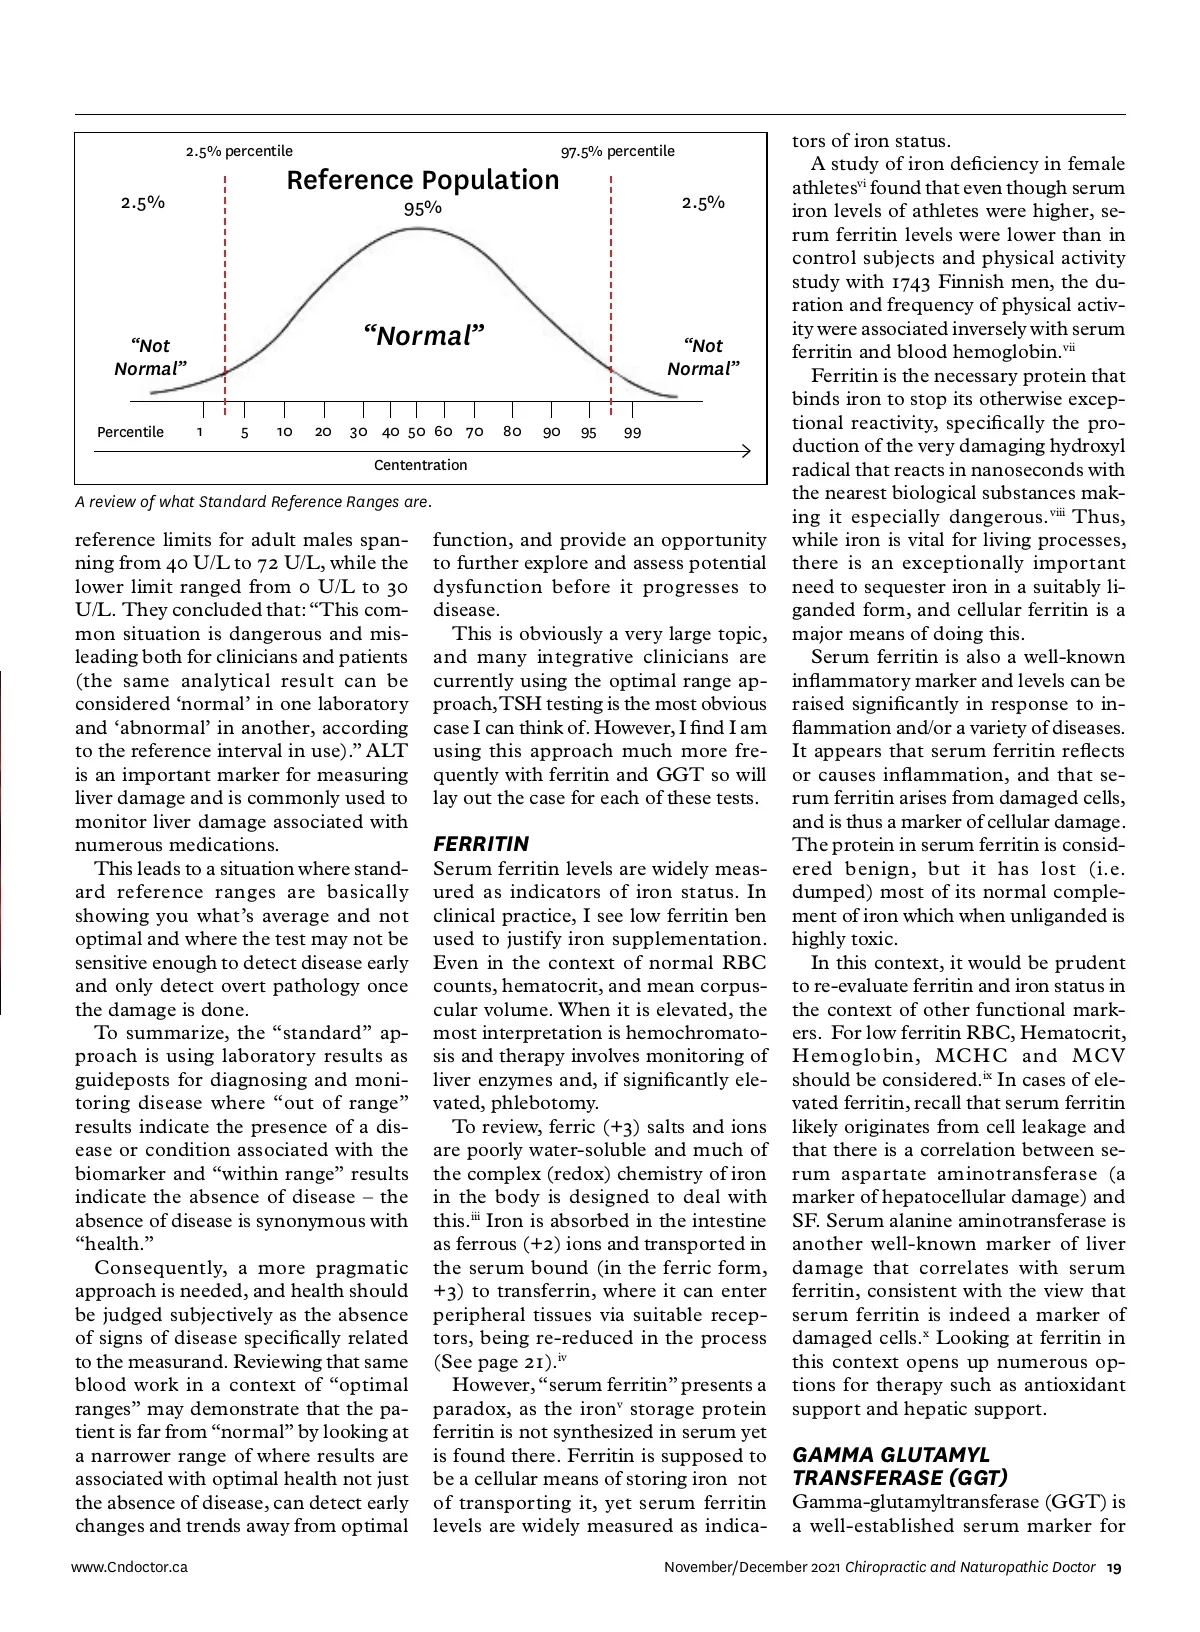
FEATURE CLINICAL TECHNIQUES INTERPRETING BLOOD BIOMARKERS Ferritin and GGT as measures of inflammation and oxidative stress BY DR. CHRIS SPOONER, ND “ I feel terrible, but my blood work says everything is normal and that there’s nothing wrong.” Patients appreciate it when you can help them makes sense of their contradiction, and in my experi-ence, the interpretation of blood work is one area they find enormously frustrating. They expect results to explain their symptoms (fatigue, weight gain, pain, inflammation, hormone imbalance, etc). The challenge is that physicians often consider patients “healthy” or “normal” when results are within the normal standard lab reference range, even when the “unwell” patient feels far from “normal.” In this article, I’d like to discuss how to talk to patients about what these results represent, and use ferritin and GGT as examples of two common tests that can provide more insight than is what's commonly used for inflamma-tion and oxidative stress. WHY DOES THIS HAPPEN? DR. CHRIS SPOONER ND, B.SC. is a North Okanagan naturopathic doctor with 20 years of clinical experience. In his private practice, Paradigm Integrative Medicine, Dr. Spooner works with patients looking for a balanced approach to health care that combines conventional medicine with research informed integrative approaches. Dr. Spooner has advanced certifications through the College of Naturopathic Physicians of B.C., including prescriptive authority. He has been a board member and vice chair of the College of Naturopathic Physicians of British Columbia since 2008. 18 Chiropractic and Naturopathic Doctor November/December 2021 www.Cndoctor.ca Photo: abhijith3747/Adobe stock First, let’s start with a review of what exactly standard reference ranges (SRR) are. SRR’s are a statistical analysis and represent a distribution of results according to populations. (Op-posite page.) I refer to this as “medicine by aver-age,” and while there is great utility in understanding the larger associations and trends, these may not apply to an individual. Take a look at the data on page 20, looking at alkaline phos-phatase as an indicator of zinc and magnesium deficiency. i The authors concluded that “a sig-nificant decrease in Zn and Mg level in our group of cases suggest(ed) the fact that, ALP is a Zn containing metal-lo-enzyme and Mg is an important promoter of ALP…. There is a positive correlation between Zn and Alkaline phosphatase in these groups signifying the fact that Zn raises the activities of alkaline phosphatases, particularly of bone. ALP activity is not only impor-tant for increase in its activity, but it is also important for decrease in its activ-ity. Zn and Mg deficiency are the most important causes of low ALP activity.” However, look at how many points are actually on the line and the propor-tion of how many points are above and below. There are several individuals It's great to understand the larger trends, but these may not apply to an individual. where this is clearly not the case and high ALP exists in the presence of significant zinc and magnesium defi-ciency (red boxes). So, it’s important to recognize that SRRs represent a distribution of results according to statistical analysis, not physiological function. There is seldom a “universally applicable” reference value as population averages and ranges show variability according to geography and the lab used to run the test, with normal ranges shifting as with the health of the population tested (i.e., gets younger or older, get sicker, more obese, more CVD, etc). Cerotti ii noted that 93 laboratories in Italy, all claiming to use standard pro-cedure testing ALT, had upper
Chiropractic + Naturopathic Doctor November/December 2021: Page 18