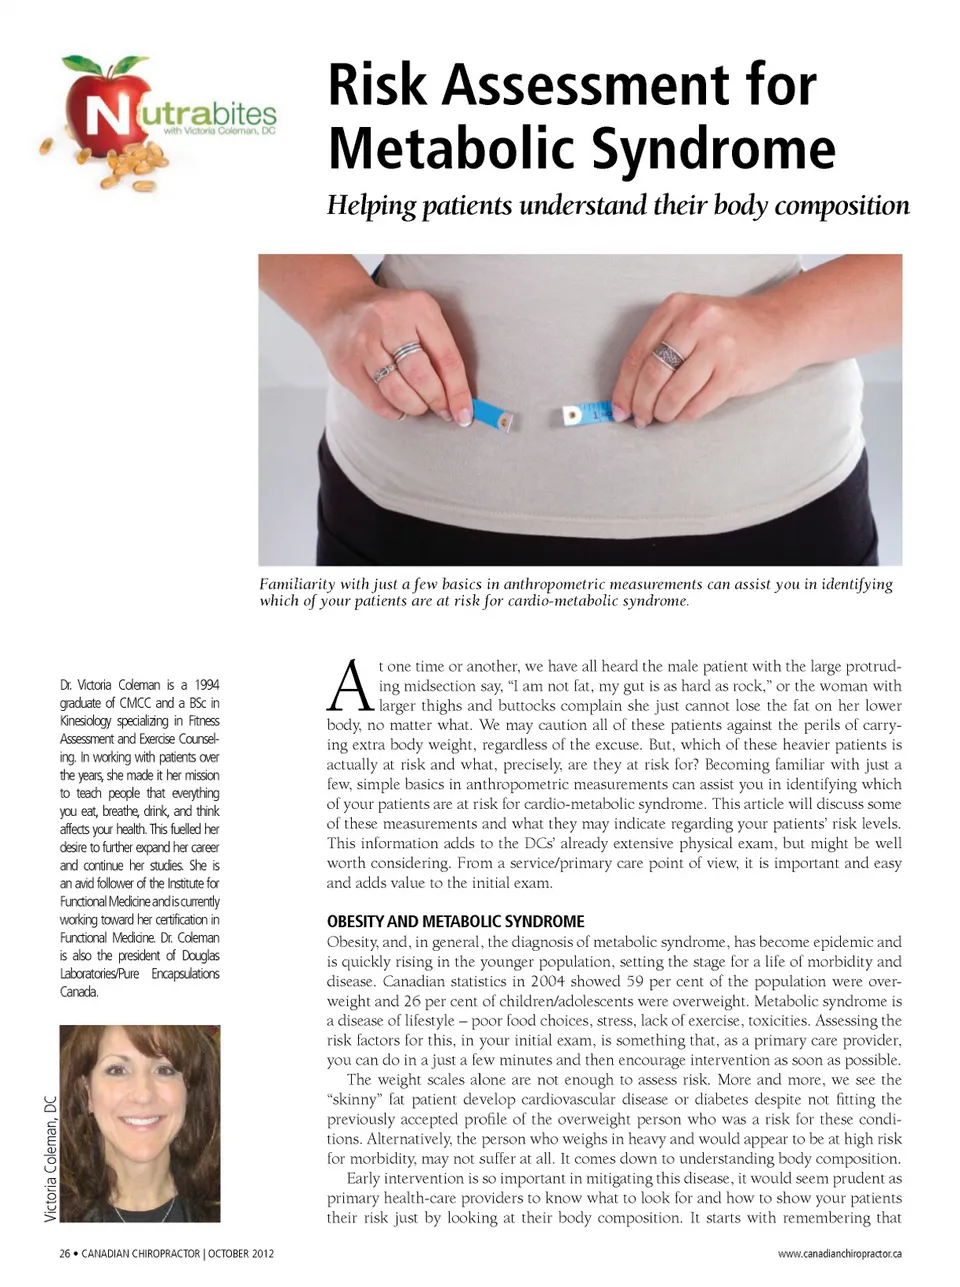
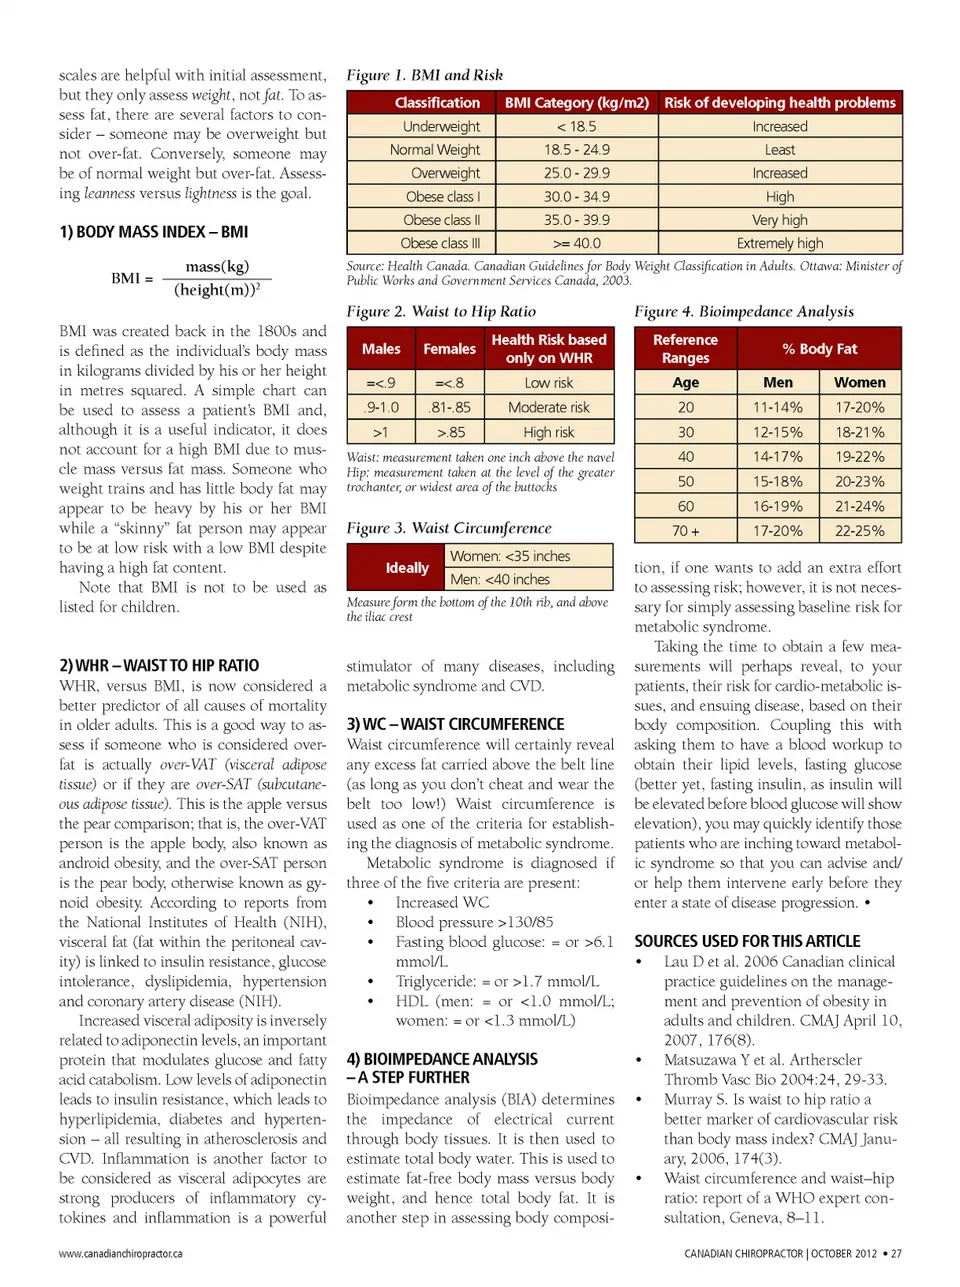
scales are helpful with initial assessment, but they only assess weight , not fat . To as-sess fat, there are several factors to con-sider – someone may be overweight but not over-fat. Conversely, someone may be of normal weight but over-fat. Assess-ing leanness versus lightness is the goal. Figure 1. BMI and Risk Classification Underweight Normal Weight Overweight Obese class I Obese class II Obese class III BMI Category (kg/m2) < 18.5 18.5 -24.9 25.0 -29.9 30.0 -34.9 35.0 -39.9 >= 40.0 Risk of developing health problems Increased Least Increased High Very high Extremely high 1) BODY MASS INDEX – BMI BMI = mass(kg) (height(m)) 2 Source: Health Canada. Canadian Guidelines for Body Weight Classification in Adults. Ottawa: Minister of Public Works and Government Services Canada, 2003. Figure 2. Waist to Hip Ratio BMI was created back in the 1800s and is defined as the individual’s body mass in kilograms divided by his or her height in metres squared. A simple chart can be used to assess a patient’s BMI and, although it is a useful indicator, it does not account for a high BMI due to mus-cle mass versus fat mass. Someone who weight trains and has little body fat may appear to be heavy by his or her BMI while a “skinny” fat person may appear to be at low risk with a low BMI despite having a high fat content. Note that BMI is not to be used as listed for children. Males =<.9 .9-1.0 >1 Females =<.8 .81-.85 >.85 Health Risk based only on WHR Low risk Moderate risk High risk Figure 4. Bioimpedance Analysis Reference Ranges Age 20 30 40 50 60 70 + % Body Fat Men 11-14% 12-15% 14-17% 15-18% 16-19% 17-20% Women 17-20% 18-21% 19-22% 20-23% 21-24% 22-25% Waist: measurement taken one inch above the navel Hip: measurement taken at the level of the greater trochanter, or widest area of the buttocks Figure 3. Waist Circumference Ideally Women: <35 inches Men: <40 inches Measure form the bottom of the 10th rib, and above the iliac crest 2) WHR – WAIST TO HIP RATIO WHR, versus BMI, is now considered a better predictor of all causes of mortality in older adults. This is a good way to as-sess if someone who is considered over-fat is actually over-VAT (visceral adipose tissue) or if they are over-SAT (subcutane-ous adipose tissue). This is the apple versus the pear comparison; that is, the over-VAT person is the apple body, also known as android obesity, and the over-SAT person is the pear body, otherwise known as gy-noid obesity. According to reports from the National Institutes of Health (NIH), visceral fat (fat within the peritoneal cav-ity) is linked to insulin resistance, glucose intolerance, dyslipidemia, hypertension and coronary artery disease (NIH). Increased visceral adiposity is inversely related to adiponectin levels, an important protein that modulates glucose and fatty acid catabolism. Low levels of adiponectin leads to insulin resistance, which leads to hyperlipidemia, diabetes and hyperten-sion – all resulting in atherosclerosis and CVD. Inflammation is another factor to be considered as visceral adipocytes are strong producers of inflammatory cy-tokines and inflammation is a powerful www.canadianchiropractor.ca stimulator of many diseases, including metabolic syndrome and CVD. 3) WC – WAIST CIRCUMFERENCE Waist circumference will certainly reveal any excess fat carried above the belt line (as long as you don’t cheat and wear the belt too low!) Waist circumference is used as one of the criteria for establish-ing the diagnosis of metabolic syndrome. Metabolic syndrome is diagnosed if three of the five criteria are present: • Increased WC • Blood pressure >130/85 • Fasting blood glucose: = or >6.1 mmol/L • Triglyceride: = or >1.7 mmol/L • HDL (men: = or <1.0 mmol/L; women: = or <1.3 mmol/L) 4) BIOIMPEDANCE ANALYSIS – A STEP FURTHER Bioimpedance analysis (BIA) determines the impedance of electrical current through body tissues. It is then used to estimate total body water. This is used to estimate fat-free body mass versus body weight, and hence total body fat. It is another step in assessing body composi-tion, if one wants to add an extra effort to assessing risk; however, it is not neces-sary for simply assessing baseline risk for metabolic syndrome. Taking the time to obtain a few mea-surements will perhaps reveal, to your patients, their risk for cardio-metabolic is-sues, and ensuing disease, based on their body composition. Coupling this with asking them to have a blood workup to obtain their lipid levels, fasting glucose (better yet, fasting insulin, as insulin will be elevated before blood glucose will show elevation), you may quickly identify those patients who are inching toward metabol-ic syndrome so that you can advise and/ or help them intervene early before they enter a state of disease progression. • SOURCES USED FOR THIS ARTICLE • Lau D et al. 2006 Canadian clinical practice guidelines on the manage-ment and prevention of obesity in adults and children. CMAJ April 10, 2007, 176(8). • Matsuzawa Y et al. Artherscler Thromb Vasc Bio 2004:24, 29-33. • Murray S. Is waist to hip ratio a better marker of cardiovascular risk than body mass index? CMAJ Janu-ary, 2006, 174(3). • Waist circumference and waist–hip ratio: report of a WHO expert con -sultation, Geneva, 8–11. CANADIAN CHIROPRACTOR | OCTOBER 2012 • 27
Chiropractic + Naturopathic Doctor October 2012: Page 27